The Spectrogram and The Gabor Transform
Summary
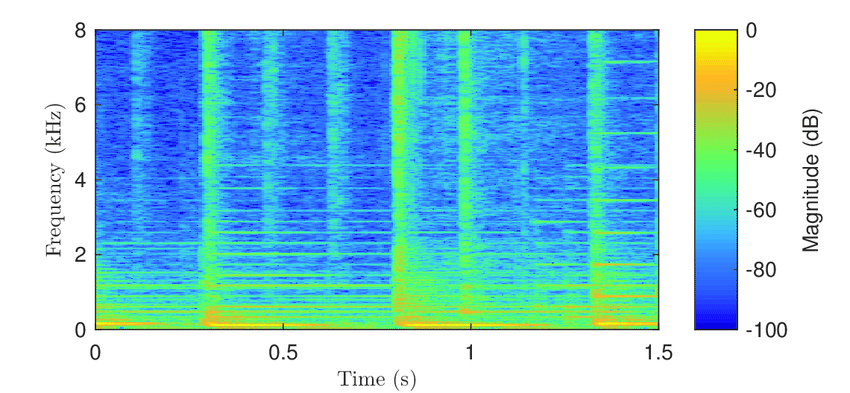
The Gabor transform is used to compute the spectrogram, which shows the frequency content and temporal information of a signal. It is useful for analyzing Brain Activity Signal, EEG, audio signals and classifying sounds.
Gabor Transform
The Gabor transform of a signal ( x(t) ) is defined by this formula:
In this equation:
- ( x(t) ) is the signal to be transformed.
- The term : represents a Gaussian window function, which gives higher weight to the signal near the time being analyzed.
- The term : is the Fourier transform, which gives the frequency components of the signal.
- The integral over all time to calculates the Fourier transform for each position of the Gaussian window, resulting in a time-frequency analysis.
Highlights
- 🎵 The Gabor transform computes the spectrogram, showing frequency and temporal information of a signal.
- 🎹 The Fourier transform gives frequency components of a signal, but not their timing.
- 📊 The Gabor transform combines frequency and temporal information to create a time-frequency plot.
- 🌊 The spectrogram is useful for classifying sounds, analyzing data, and identifying features in audio signals.
- 🎶 Shazam uses the spectrogram to match peaks in the power spectrum with known songs.
- 🎸 The spectrogram can help classify instruments and even differentiate musicians based on their playing style.
- 🎹 The spectrogram of Beethoven’s sonata reveals the timing and intensity of each note.
Key Insights
- 💡 The Fourier transform provides frequency information, while the Gabor transform combines frequency and temporal information in the spectrogram.
- 💡 The spectrogram is a valuable tool for analyzing audio signals, classifying sounds, and identifying features in data.
- 💡 Shazam uses the spectrogram to match peaks in the power spectrum with known songs, even accounting for speed variations.
- 💡 The spectrogram can be used to classify instruments and differentiate musicians based on playing styles.
- 💡 The Gabor transform and spectrogram allow us to visualize the timing and intensity of notes in musical compositions.
- 💡 The spectrogram is particularly useful for studying time-varying signals that are not perfectly periodic, like audio recordings.
- 💡 Coding the spectrogram and working with time-frequency diagrams can provide further insights into audio signals and their characteristics.
